
October 14, 2026
How Orthodontic Analytics Turn Everyday Data Into Better Clinical and Business Decisions
Orthodontic analytics connects clinical and practice data to support smarter treatment and business decisions. This guide breaks down the clinical metrics that shape treatment planning, the practice metrics that reveal operational health, and how AI assists—without replacing—the orthodontist’s judgment. Learn how to build a data-driven workflow that keeps the doctor in control.


SoftSmile Team
Editorial Team


In 2026, orthodontic analytics turns existing clinical and business data into practical decisions. Practices collect scans, CBCT volumes, case acceptance figures, and chair-time logs. Yet many doctors still struggle to identify which numbers should change Monday’s work. This guide covers the clinical metrics behind treatment, the practice metrics behind the business, and the role of AI in connecting them while keeping the doctor in control.
In this guide you’ll learn:
● What this data-driven approach actually means in daily practice.
● Which clinical metrics drive treatment decisions.
● Which practice metrics drive business growth.
● How AI supports — not replaces — your clinical judgment.
● How to build a data-driven workflow step by step.
What Is Orthodontic Analytics?
Orthodontic analytics connects clinical and practice data so teams can make explainable decisions. Federal guidance describes predictive decision support as using relationships learned from training data to help a user decide (HealthIT.gov). Software can organize information and surface patterns, while the clinical or business team interprets them. The AAO 2025 Economics of Orthodontics Survey (link) provides specialty-level practice benchmarks.
It helps to think of this as two layers that rarely get discussed together, even though they constantly interact.
Clinical analytics covers diagnosis and treatment planning: cephalometric measurements, tooth segmentation, staging simulations, case-difficulty scoring, and predicted treatment duration. This is the layer that answers questions like “how should this specific malocclusion be staged” and “what’s a realistic timeline for this patient.”
Practice analytics covers the business side: case acceptance rate, chair-time and utilization, patient throughput, and referral sources. This layer answers a different set of questions — “which consultations convert,” “where is chair time being lost,” “which referral channel actually pays for itself.”
Clinical and business analytics can share infrastructure without becoming the same product. An orthodontic treatment planning software platform may record case type, stage count, approval time, and revisions. Practice systems hold consultations, starts, schedules, collections, and referrals. Stable identifiers and clear definitions allow a reporting layer to compare workload with performance.
Clinical Metrics That Drive Treatment Decisions
Clinical metrics are the numbers a doctor weighs before deciding whether and how to move a tooth. They include diagnostic records, biometric measurements, and predictive estimates of case behavior.
Diagnostic & Biometric Data (Scans, CBCT, Cephalometrics)
Clinical decisions begin with records: an intraoral scan or impression, photographs, and a panoramic X-ray. Impacted teeth, borderline extractions, or surgical cases may also require CBCT and a lateral cephalogram. STL scans and DICOM volumes can be combined to show crown surfaces and root positions.
Tooth segmentation isolates each tooth from the gingiva and neighboring teeth so it can be staged independently. VISION supports segmentation and staging workflows, helping convert scans into structured data for review.
Key Clinical Variables (Crowding, ANB, Overjet, Overbite)
A handful of measured variables recur across almost every treatment plan, and their thresholds are well established in the orthodontic literature:
● ANB angle — measures the sagittal relationship between the maxilla and mandible. An average Class I skeletal pattern sits around 2°; a reading above 4° suggests a Class II pattern, and below 2° suggests Class III (StatPearls, Cephalometric Analysis).
● Crowding — commonly classified by the space deficit in the arch: mild under 4 mm, moderate 4–8 mm, and severe above 8 mm (Cobourne & DiBiase, Handbook of Orthodontics, 2010).
● Overjet — the horizontal distance between the upper and lower incisors; more than roughly 3 mm is generally flagged for evaluation.
● Overbite — the vertical overlap of the upper incisors over the lower, normally about 30–50% of the lower incisor crown height.
No single number dictates a plan. A 6 mm overjet in a growing patient differs from the same finding in an adult. Metrics support clinical judgment; they do not replace it.
Predictive Metrics (Case Difficulty, Treatment Duration, Risk)
Predictive orthodontic treatment planning now supports early case review. A case-difficulty score can estimate staging complexity before a full setup. Duration estimates help set expectations. Risk tools may also flag a higher chance of refinement based on compliance, crowding, or bite complexity.
Research is expanding, but the results remain decision-support signals. A 2024 study compared seven machine-learning models with extraction decisions for 1,000 patients (Köktürk et al., 2024). A multi-institutional study tested generalizability across 1,135 patients from two clinics. An earlier automated model used cephalometric and clinical variables. None removes the need for clinical review.
VISION Forecast is a module currently in development to support the early review of new cases. It is designed to generate a diagnostic summary for a new case — covering approximate aligner requirements, case complexity, and commonly used treatment strategies — and to help a doctor compare approaches, such as with or without extractions, and estimate potential treatment duration before detailed planning begins. Its output supports a clinical decision; interpretation and treatment choices remain with the orthodontist.

Practice Metrics That Drive Business Growth
Clinical data shows what a case needs. Orthodontic practice metrics show whether the business around those cases is healthy. This layer often receives less attention, even though it can reveal fast operational gains.
Financial & Conversion Metrics
Case acceptance measures the share of presented treatment plans that patients accept. Exam-to-start rate measures the share of completed new-patient examinations that lead to treatment starts within a defined follow-up window. In the AAO 2025 survey, 115 respondents averaged 488 examinations and 312 starts in 2024. That is a 64% exam-to-start rate, versus 66% in 2022. It is a benchmark, not a universal target. Insurance mix, referrals, fees, case complexity, and definitions all affect the result.
Other financial and conversion metrics worth tracking alongside acceptance rate:
● Revenue per case — average production value per treatment started, which varies meaningfully between braces and aligner cases.
● Treatment start rate — the share of accepted plans that actually convert to a scheduled start, catching drop-off that acceptance rate alone misses.
● Average days to start treatment — how long a patient waits between accepting a plan and the first appliance appointment; a long gap is where accepted cases quietly turn into no-shows or second opinions.
● Case starts per respondent — the AAO survey reported an average of 312 new-patient starts in 2024, the highest in its series. Treat this as a reference point, not a quota. Compare it with your own history and capacity.
Operational Metrics
Operational metrics track how efficiently the practice moves patients through the day rather than how much revenue each patient generates:
● Chair time — the productive minutes per appointment slot, and how much of that time goes to value-adding clinical work versus waiting or setup.
● Chair utilization — the share of available chair hours actually used for patient care, which shows how much clinical capacity remains before new starts begin to strain the schedule.
● Revenue per chair hour — production divided by the hours a chair is actually in use, which exposes underperforming operatories that a raw production number hides.
● Patient throughput — the number of patients moved through a clinic day without a quality drop-off.
● No-show rate by appointment type — a flat no-show percentage hides whether it’s consults, debonds, or routine checks driving the loss, and each of those needs a different fix.
● Referral sources — tracking which channel (general dentist, existing patient, digital) actually produces starts, not just exams, since the two numbers often diverge.
Reporting depth varies by practice system. First confirm that exams, starts, cancellations, appointment types, chair use, and referrals use consistent timestamps and definitions. A reliable monthly series is better than a larger report built from inconsistent fields.
How to Read the Metrics Together
Read these measures as a sequence rather than as isolated scores. Case acceptance shows whether proposed treatment is being accepted; exam-to-start shows whether examinations turn into actual treatment starts; chair utilization shows whether the practice has enough clinical capacity to absorb those starts. High case acceptance with a weaker exam-to-start rate can point to friction after the consultation, such as financing, follow-up, or scheduling. If both conversion measures are strong while chair utilization is already high, the next constraint may be capacity rather than lead generation.
Use a cohort view where possible. A patient examined in one month may not start until the next, so comparing same-month exams with same-month starts can create a false signal. Review the three metrics over one consistent window, then decide whether the intervention belongs in consultation, follow-up, scheduling, or staffing.
How Clinical and Business Data Connect
Clinical and business data are connected, but not automatically combined. Planning tools record case type, stages, revisions, and approval time. Business systems record consultations, starts, schedules, collections, and referrals. Stable case identifiers can link both layers without implying that planning software is a full business-intelligence dashboard.
For example, a practice could compare case complexity or revision history with chair-time demand, or compare approval time with days to treatment start. That analysis requires clean identifiers and consistent definitions. It does not require the treatment-planning system to become a full business-intelligence platform.

The Role of AI in Orthodontic Analytics — Assistant, Not Replacement
Machine learning supports predictive orthodontic treatment planning through segmentation, first-pass staging, and probability estimates. Federal guidance defines predictive decision support as technology that learns relationships from data and produces a prediction, classification, recommendation, evaluation, or analysis (HealthIT.gov). The output informs a professional decision; it does not prove that an action is correct. In VISION, automation prepares parts of the setup, while the orthodontist reviews the plan.
The limitations are worth naming plainly rather than glossing over, because this is exactly where trust in the whole system is won or lost:
● Data quality and generalizability — test performance on defined datasets that resemble the intended patients and conditions. NIST recommends reporting the test method and checking results beyond the training setting.
● Representation and harmful bias — strong overall results may hide differences between patient groups. Data provenance, subgroup coverage, and external validation matter.
● Explainability and interpretability — users need to know what an output means, which inputs shaped it, and where uncertainty limits it. An unexplained score is difficult to challenge safely.
● Clinical verification — accuracy alone does not establish trust. NIST also emphasizes validity, reliability, safety, transparency, privacy, and bias management. The doctor must still assess periodontal health, roots, growth, biomechanics, and patient goals.
The FDA Clinical Decision Support Software guidance offers a practical test for reviewability. A professional should understand the intended use, inputs, basis, validation, and key unknowns. FDA also warns about over-reliance on automated suggestions. A product’s status still depends on its intended use and functions.
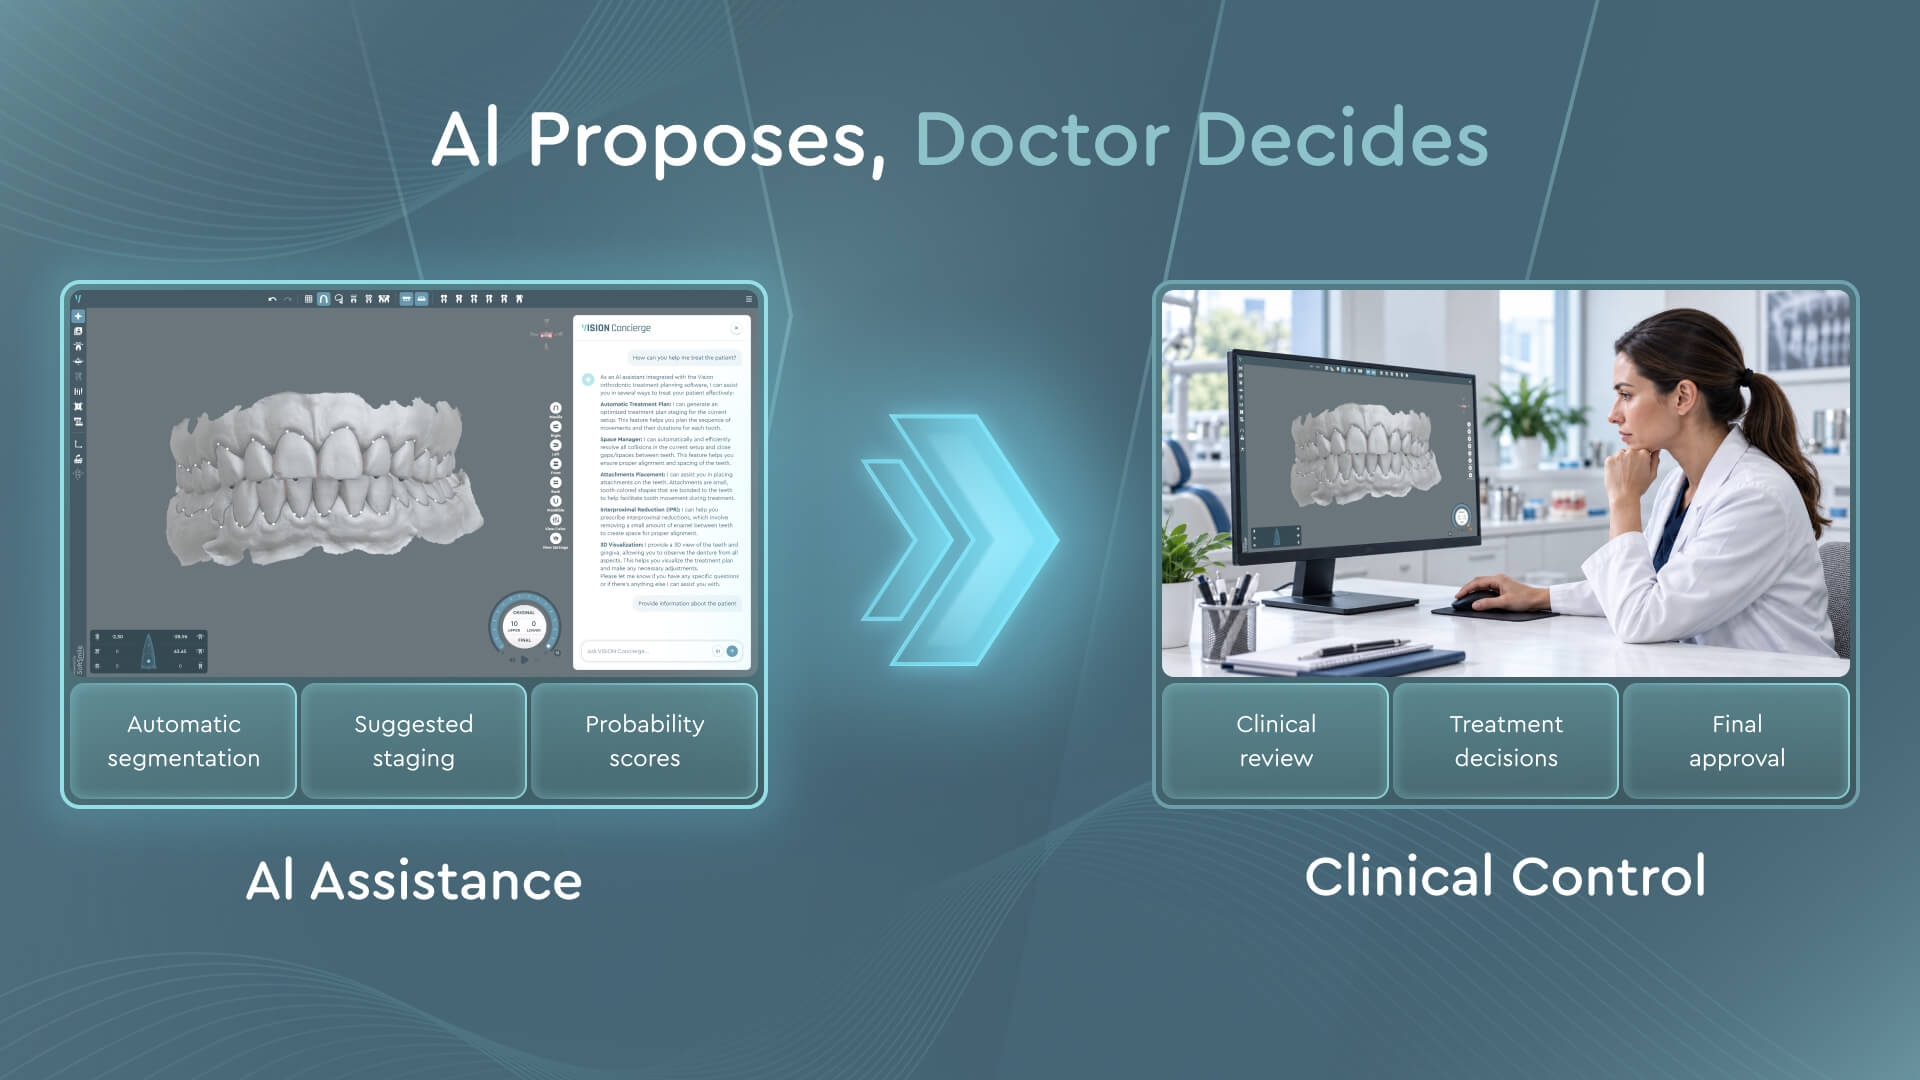
A related category of AI in the same ecosystem works on navigation and administrative tasks rather than clinical prediction. Launched in July 2026, VISION Concierge, a conversational interface inside the VISION Portal, can search and filter patient records, create or update a patient record from a request, summarize clinical notes, translate correspondence, and open a specific case or the 3D treatment editor directly — replacing several manual menu steps with one request. The clinical action itself, such as approving a plan or editing a setup, still routes to the orthodontist; the assistant handles the lookup and navigation around it. Because it runs inside the same portal used for case management, it does not require a separate tool or login, and the time it saves on routine searches and data entry is a direct operating-cost benefit, distinct from the clinical predictions discussed above.
Data Privacy, Trust & Compliance
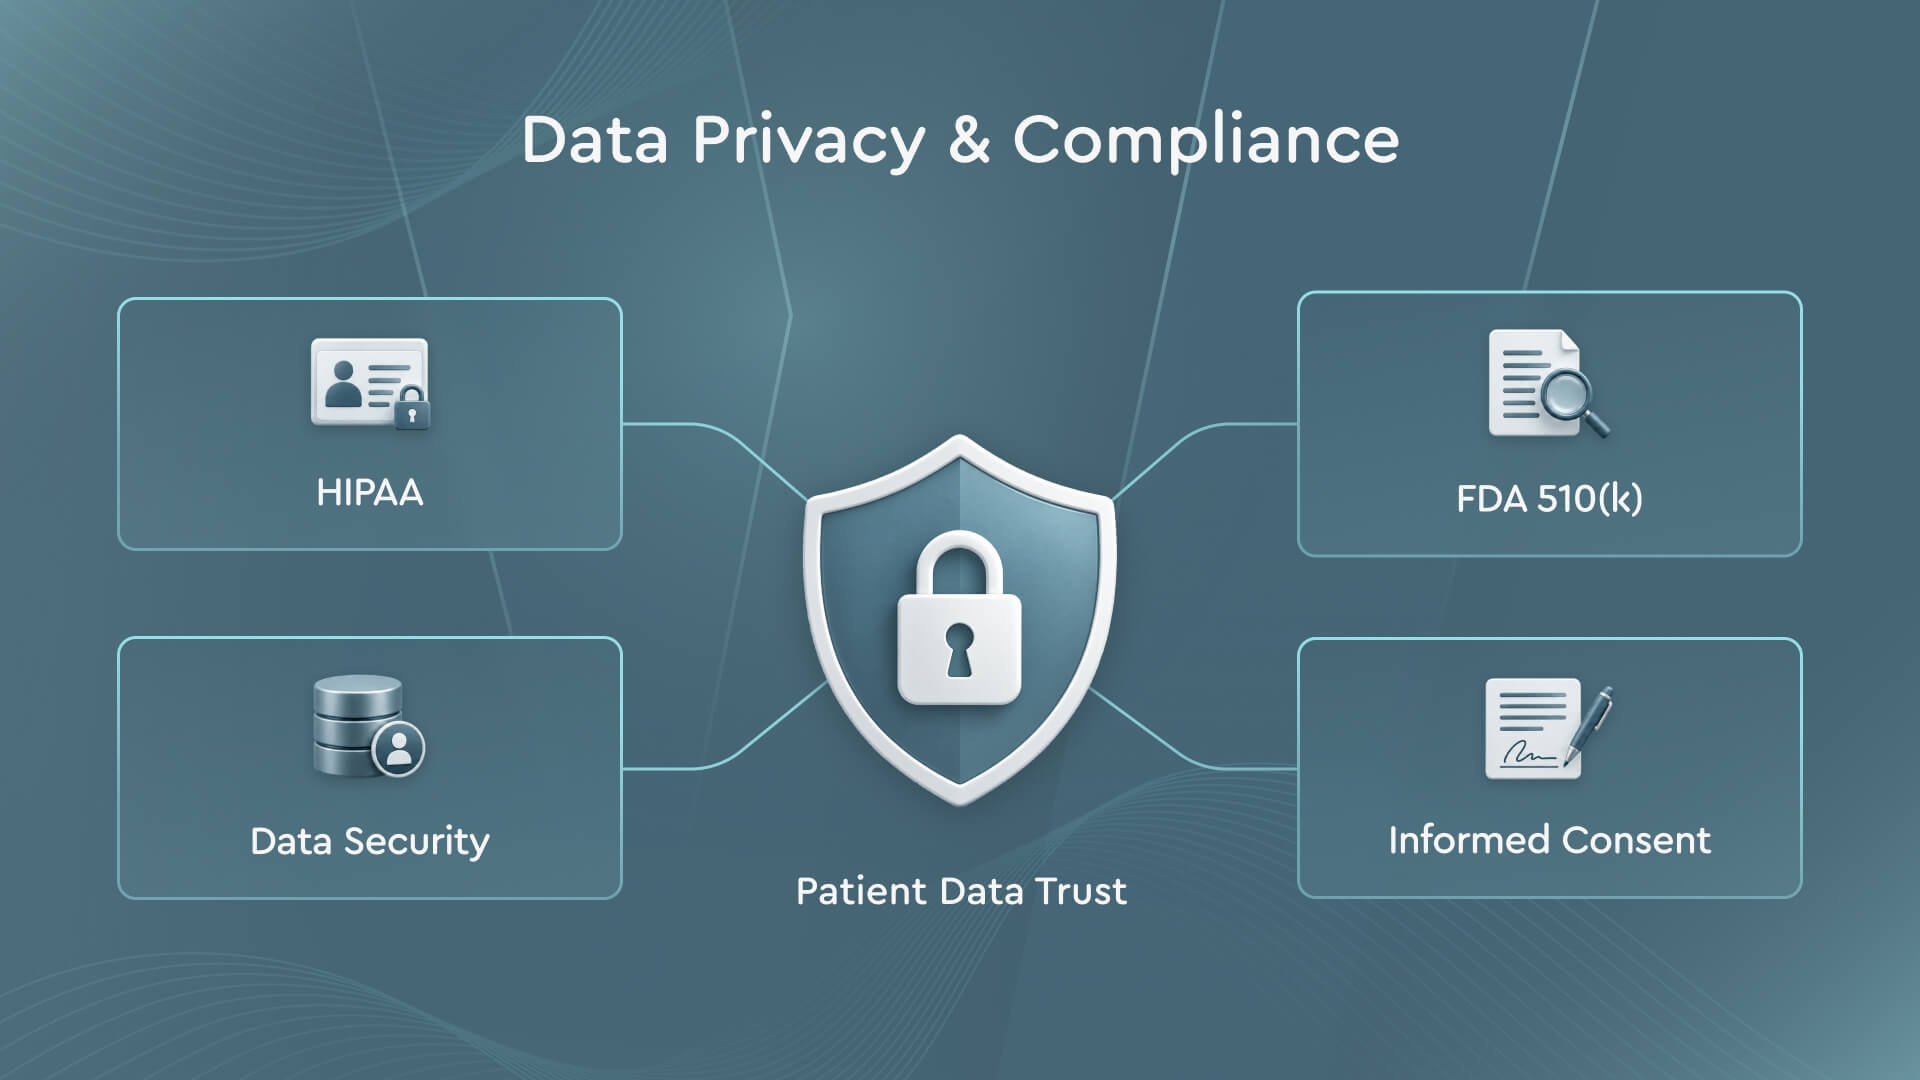
Orthodontic records may include identifiable scans, images, findings, contact details, and payment data. HIPAA protects identifiable health information handled by covered entities and business associates. 45 CFR Part 160 defines general requirements; Privacy and Security provisions appear in 45 CFR Part 164. First identify who holds the data, why it is used, and which legal pathway applies.
Removing a patient’s name does not by itself de-identify a record. HHS recognizes Safe Harbor and Expert Determination. Safe Harbor removes specified identifiers. Expert Determination documents a very small re-identification risk. Even properly de-identified data carries a small residual risk (HHS guidance).
Consent and authorization must be described precisely. HIPAA does not require a new authorization for every internal or operational use. The rule depends on the purpose, parties, and whether the data remains PHI. Research, marketing, product development, and model training may follow different requirements. Document the legal basis and seek privacy or legal review when needed.
Product-specific status should also be verified at the source. VISION, for example, received FDA 510(k) clearance under K212770. Clearance does not replace a practice’s own privacy, security, and vendor review.
Practical controls for a data-driven practice include:
● Map which systems receive PHI. Confirm each vendor’s role and execute a business associate agreement when HIPAA requires one.
● Apply role-based access, audit logging, security controls, and the minimum-necessary standard where that standard applies.
● For benchmarking or model development, select the proper pathway: permitted use of PHI, a limited data set with a data use agreement, aggregated results, or formal de-identification.
● Document the purpose, fields, recipients, retention period, and legal basis. Reassess the controls when datasets are linked, as linkage can raise re-identification risk.
Building a Data-Driven Orthodontic Workflow
Knowing the right metrics is only the first step. The workflow must capture them without adding avoidable administrative work.

1. Unified data collection. Scans, photographs, CBCT, and intake forms land in one system instead of scattered folders, so nothing has to be re-keyed later.
2. Segmentation and staging. The raw scan becomes a structured, tooth-by-tooth digital setup, generating the case-level records that both clinical and business metrics depend on.
3. Visualization. The proposed plan, staging sequence, and any predictive scores are presented in a format the doctor can actually evaluate — not a spreadsheet of coordinates.
4. Clinician interpretation and monitoring. The doctor checks the plan against periodontal health, growth, biomechanics, and patient goals. An intermediate scan can then show whether teeth are tracking and whether an update is needed.
5. Metrics and reporting. Planning tools provide approval time, stage count, and revision history. Practice systems provide exams, starts, schedules, and financial data. Connect them only when identifiers and definitions align.
VISION and Portal show the clinical side of this workflow. Doctors can review, revise, approve, and monitor setups. Acceptance, chair use, and revenue usually remain in a separate reporting layer unless the practice adds an integration or export process.
Within that same environment, VISION Concierge reduces the number of manual steps involved in day-to-day case handling: finding a patient, checking a case's status, or opening a plan for review can happen through a single request instead of a multi-click search. That is a time saving for the doctor and front-desk team specifically, even though it does not, on its own, populate the business-metrics layer described earlier.

SoftSmile — Digital Treatment Planning That Keeps the Doctor in Control
SoftSmile develops VISION, a digital treatment-planning platform with AI-assisted workflow tools. It supports segmentation, staging, 3D visualization, and CBCT-based review. The orthodontist reviews and adjusts the setup before approval.
Matching compares current tooth positions with the approved plan using an intermediate scan. It helps the doctor identify deviations and decide whether the treatment plan needs adjustment.
The VISION Portal includes VISION Concierge, launched in 2026, a conversational interface for patient records, clinical notes, workflow navigation, and plan-modification requests. It can search and filter patient data, create or update a patient record, summarize clinical notes and team communications, translate correspondence, and open the 3D treatment editor directly from a request — each replacing a multi-step manual process with one. Clinical review remains with the doctor.
Conclusion — From Data to Decisions
Orthodontic analytics connects what clinical records reveal about treatment with what business data reveals about the practice. Clinical metrics shape the plan. Practice metrics show whether the operation behind it is sustainable. AI can accelerate both layers, but the doctor remains responsible for interpretation and approval. Start with a few useful measures, capture them consistently, and improve the workflow one case at a time.
FAQ
What does analytics mean in an orthodontic practice?
It means converting clinical information, such as scans and staging, and practice information, such as case acceptance and chair time, into decisions a doctor or practice owner can act on.
Which practice metrics matter most?
Case acceptance, treatment starts, revenue per chair hour, and no-show rate cover many core questions. A few consistently reviewed metrics are more useful than a long dashboard nobody acts on.
Does AI make treatment decisions instead of the orthodontist?
No. AI may propose segmentation, staging, or a probability score. The doctor reviews the inputs, limits, and clinical context before approval. FDA guidance stresses independent review; a tool’s regulatory status depends on its intended use and functions.
Is patient data safe in analytics software?
That depends on how identifiable data is collected, used, shared, secured, and retained. Confirm the vendor’s role, use required agreements, limit access, and choose a permitted HIPAA pathway or proper de-identification for secondary uses.
What’s the difference between orthodontic practice metrics and clinical metrics?
Clinical metrics describe a patient’s malocclusion and treatment plan — ANB angle, crowding, staging. Orthodontic practice metrics describe the business around that plan — case acceptance, chair time, revenue per case.
How do I start tracking orthodontic metrics?
Start with two or three metrics from each layer — say, case acceptance rate and chair time on the business side, case-difficulty score and revision rate on the clinical side — and confirm your current workflow actually captures them before adding more.
Want to see how VISION supports planning, monitoring, and doctor-led review? Book a VISION demo.


Sign up for our newsletter!
Case Studies, Podcasts, Ebooks, Events, Webinars, Company news, and more...
By subscribing you agree to the Terms of Use and Privacy Policy.


